OEE is a KPI
OEE (Overall Equipment Effectiveness) is a standard for measuring manufacturing productivity. it identifies the percentage of manufacturing time that is truly productive. A score of 100% means you are manufacturing as fast as possible, with no Stop Time.
OEE measures how well a manufacturing operation is utilized (facilities, time, and material) compared to its full potential, during the periods when it is scheduled to run. It identifies the percentage of manufacturing time that is truly productive.
Measuring OEE is a manufacturing best practice. By measuring OEE and the underlying losses, important insights can be gained on how to systematically improve the manufacturing process. OEE is an effective metric for identifying losses, bench-marking progress, and improving the productivity of manufacturing equipment
Ideally, OEE is calculated as the product of three separate components:
- Availability: percentage of scheduled time that the operation is available to operate. Often referred to as Uptime.
- Performance: speed at which the Work Center runs as a percentage of its designed speed.
- Quality: Good Units produced as a percentage of the Total Units Started. It is commonly referred to as the first pass yield (FPY).
Read more on Wikipedia
As OEE.SERVICES is proving an easy solution, the default software does not engage Quality in the calculation. You can contact us for a custom solution for your bussiness.
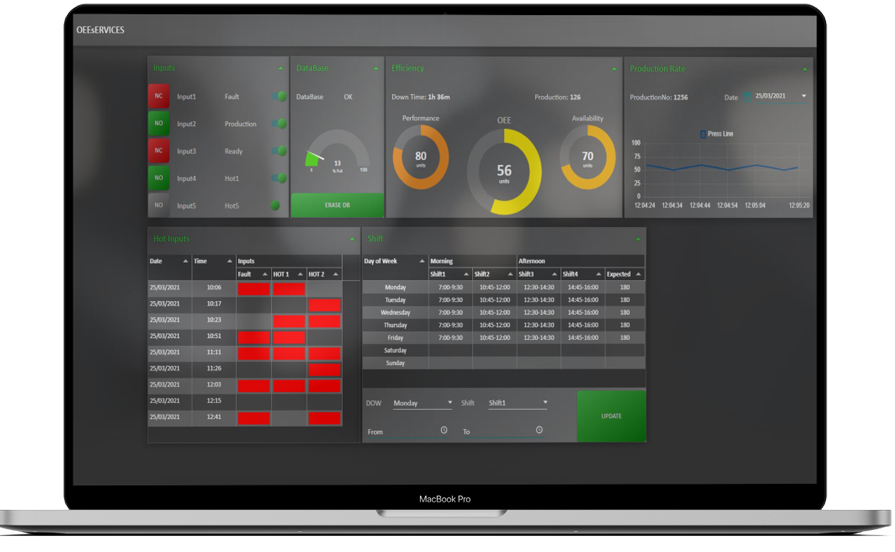
The default software uses a combination of “Fault” and “Ready” input for measuring the “Availibility”. also “Performance” is calculated based on “Production” input and also “Expected” production in each shift.
OEE.SERVICES get the information for Availability and Performance directly from the equipment. It also stores the data in a databased for future calculation.
Example:

Availability
Based on the shift table the “Planned Production Tim” for a sample day (i.e. Monday) is 540 Minutes.
The “downtime” is calculated based on “Fault” and “Ready” input. “Ready” input shows that the machine is “Ready” and waiting for the upstream feed to start. Operator can disable the “Ready” input so the downtime is calculated just based on the “Fault” input.
“Fault” input is activated for 17 minutes and the “Ready” input is activated for 67 minutes so the “Stop” time is 67+17=84 Minutes
The “Availibility” is (540-84)/(540)= 84%
Availability = Run Time / Planned Production Time
Run Time = Planned Production Time − Stop Time
Performance
The performance takes into account anything that causes the manufacturing process to run at less than the maximum possible speed when it is running (including both Slow Cycles and Small Stops). in other words Performance is the ratio of Net Run Time to Run Time.
For calculating “Performance” at first the software calculates the cycle time. Based on the shift table the “Planned Production Tim” for a sample day (i.e. Monday) is 540 Minutes. and the expected production is 180 units as a result the cycle time is 3 minutes.
Every time the “Production” input is stimulated “Total Production” is increased by 1. For example, after a full shift on Monday 140 unit is produced.
The performance is (3×140)/(540-84)=92%
Performance = (Ideal Cycle Time × Total Count) / Run Time
Quality
Quality takes into account manufactured parts that do not meet quality standards, including parts that need rework. Remember, OEE Quality is similar to First Pass Yield, in that it defines Good Parts as parts that successfully pass through the manufacturing process the first time without needing any rework.
Quality is calculated as:
Quality = Good Count / Total Count

