What is BPMN Diagram, and How Will It Affect the Project Development?
Business Process Model and Notation
A BPMN diagram is a helpful tool in the project process and development. BPMN stands for Business Process Modelling Notation. These diagrams are transparent standards to diagram the entire process of a project. The participants, options, and workflow are represented using these charts, which are very similar to flowcharts.
A BPMN diagram can describe the business process well. The diagram visualizing the power of the BPMN will show off the process flow. These diagrams can also visualize the communication between various independent methods.
A BPMN diagram has numerous benefits for project development. It allows companies and businesses to be aware of their business procedures. The notation provided by this sort of diagram is easy to understand for all company stakeholders. It’ll also bridge the interaction gap between the design and implementation of the process.
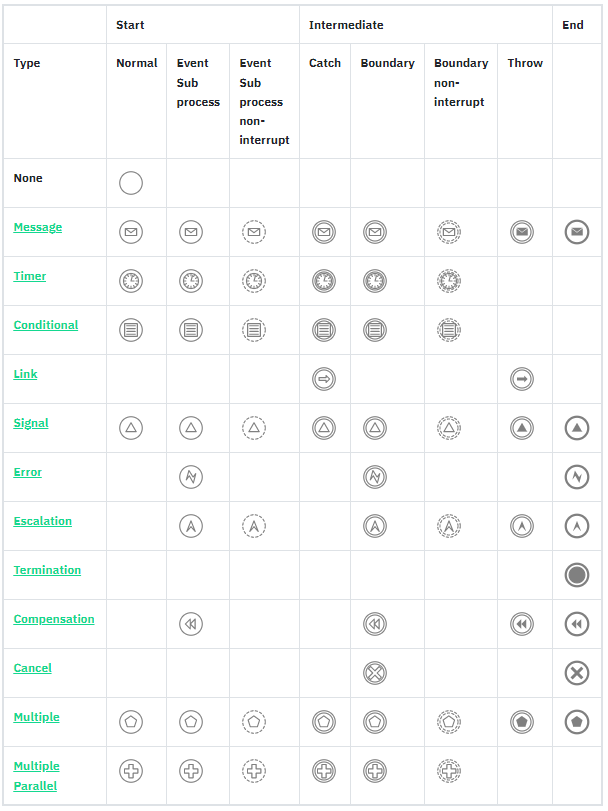
Symbol Overview
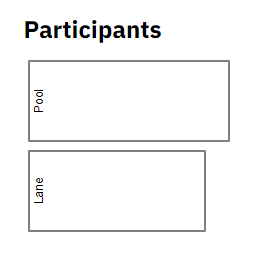
To BPMN, the pool represents a higher-ranking instance compared to its lanes. The pool assumes process control – in other words, it assigns the tasks. It behaves like the conductor of an orchestra, and so this type of process is called “orchestration.”
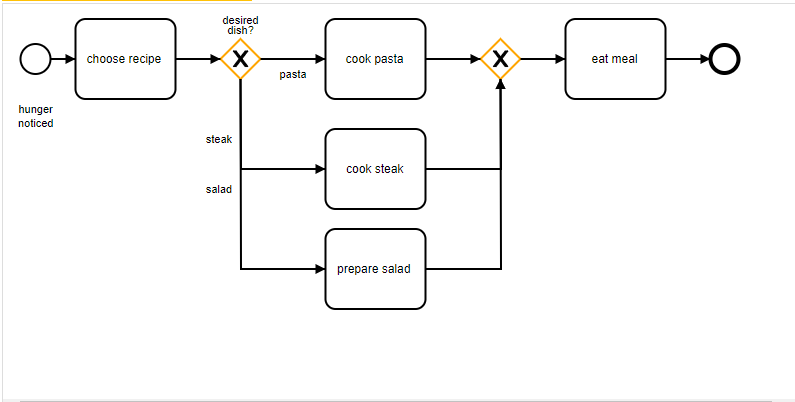
Gateway Exexutive Sample
Certain things can only be done under certain circumstances, so few processes always take the same course. In our simple example, we want to go into the details of cookery. Driven by hunger, we think about what we are going to cook today. We only know three recipes, so we choose one. We can either cook pasta or cook a steak or prepare a salad. Let’s say that these options are exclusive – we will never prepare more than one at a time. The point of decision on what to do next is called gateway. We decide based on available data (the chosen recipe) and we follow only one of the paths, which is a data-based exclusive gateway. We abbreviate “exclusive gateway” as XOR.
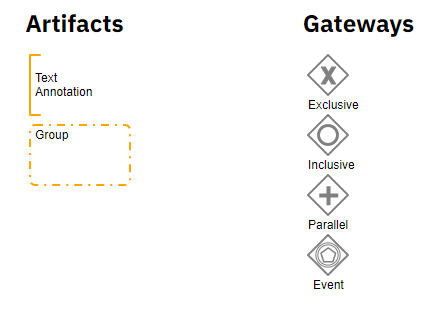
In this context
Exexutive Gateway :XOR (We goes into just one lines)
Inclusive Gateway: OR (We goes into all lines)
Inclusive Gateway: Sum (add artifacts)
Gateways Event-based : IF (Mostly Combine with Intermediate Event)
https://camunda.com/bpmn/reference/#activities-task
Process modelling captures the interrelationships between the people, processes, activities, and systems in delivering the expected outcome.
Context Diagram: outlines how external entities interact with an internal software system.
The context diagram provides the high-level framework and interaction of an organization. The context

Functional Flow Diagram performs on its inputs and outputs. . The functional flow diagram is a simple model showing the functional areas or stakeholders internally to our organization and how they interact in a logical overall flow of work.

Cross-Functional Flow Diagram: who does what and when in a grid-like diagram organized into sections. It a way to capture and sequentially display the activities that are performed. Cross-functional flow diagrams also referred to as activity diagrams, and swimlane diagrams.

Process Flowchart: shows the sequential steps of a process and the decisions needed to make the process work. In other word it show the sequential flow of activities, decision points,

UML
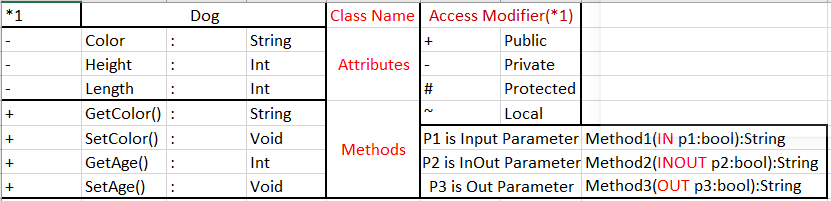
UML (Unified Modeling Language) diagrams are graphical representations that model a system’s structure, behavior, and relationships. They provide a visual way to document and analyze a system’s architecture, design, and requirements. UML diagrams are used in software engineering, business process modeling, and system analysis. UML diagrams include use case diagrams, class diagrams, activity diagrams, sequence diagrams, state diagrams, component diagrams, and deployment diagrams.
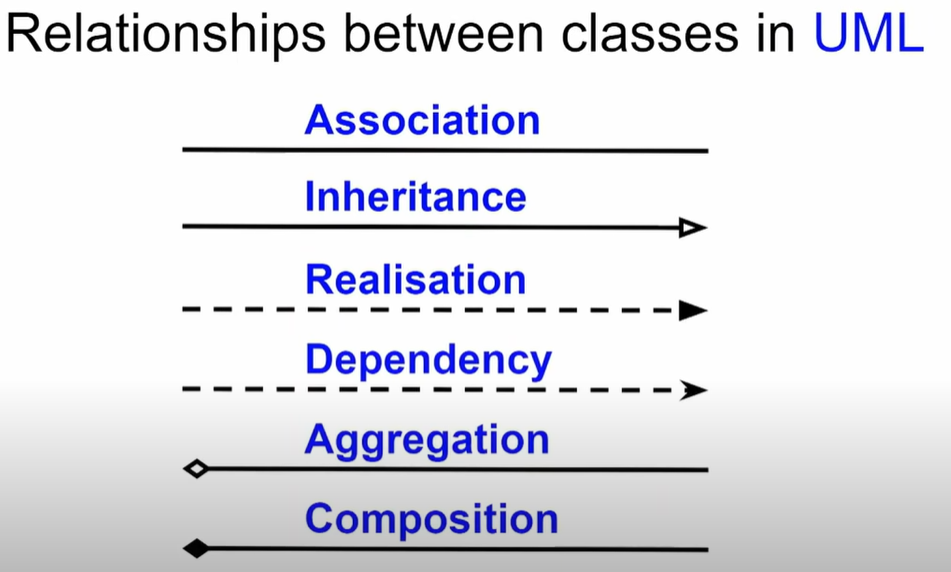
Association in OOP is a type of relationship between classes that describes how instances of one class know about and can use instances of another class. It is the ability of one object to access, use, or modify the properties and methods of another object.
Multiplicity in the Association is a way to indicate the number of objects that can participate in a given relationship. This can be used to represent one-to-one, one-to-many, many-to-one, and many-to-many relationships between objects.
Inheritance or generalization allows a class to inherit the attributes and behaviors of another class. It enables code reuse and allows the programmer to create hierarchical relationships between classes. This allows for better organization of code and easier maintenance.
Abstract class is a class that contains methods that are only declared, but not implemented. Abstract classes are used as a base class from which other classes can be derived. They cannot be instantiated and are primarily used to provide an interface for other classes.
Realisation is the process of implementing an interface by providing its methods with a body of code. It is a type of association between two classes, where one class provides the definition for the methods declared in another class. The class that provides the implementation is said to realise the other class.
Dependency is a type of association between two classes, where one class depends on the other for its functionality. It is used to indicate that one class relies on another class to provide some functionality. Dependency can be represented by an arrow pointing from the dependent class to the class it depends on.
Aggregation is a type of association between two classes, where one class has a reference to another class. It is used to indicate that one class contains or has a reference to another class. Aggregation can be represented by an arrow pointing from the containing class to the contained class.
Composition is a type of association between two classes, where one class owns or controls the other. It is used to indicate that one class is composed of or contains another class. Composition can be represented by an arrow pointing from the containing class to the contained class.
List of UML Diagram Type
Divided into 2 Main categories:
Structural Diagram
1- Composite Structure Diagram:
shows the internal structure of a system, including its parts and their relationships. It is used to model the static structure of a system, and can also be used to visualize relationships between components of a system. It is typically used to represent complex systems with many components, such as an enterprise application or a distributed system.
2- Deployment Diagram.
3- Package Diagram.
4- Profile Diagram.
5- Class Diagram.
6- Object Diagram.
7- Component diagram:
Component diagram In UML is a type of diagram that describes the components of a system and how they interact with each other. It is used to model the static view of a system, which includes the classes, interfaces, packages, and collaborations among them. Component diagrams are used to visualize the organization of components and their relationships, as well as their internal structure. Required interface (In) port is a type of port that allows a component to request a service from another component. It is used to indicate that the component can request services from the other component. Provided interface (OUT) port is a type of port that allows a component to provide a service to another component. It is used to indicate that the component can provide services to the other component.
Behavioral Diagram
1- Activity
2-Use case:
System actor use case relationship is a type of relationship between a system and an actor that describes the interaction between them. It is used to describe the actions that the actor can perform with the system, as well as the actions that the system can take in response to the actor’s requests. System actor use case relationships are represented by an arrow pointing from the system to the actor.
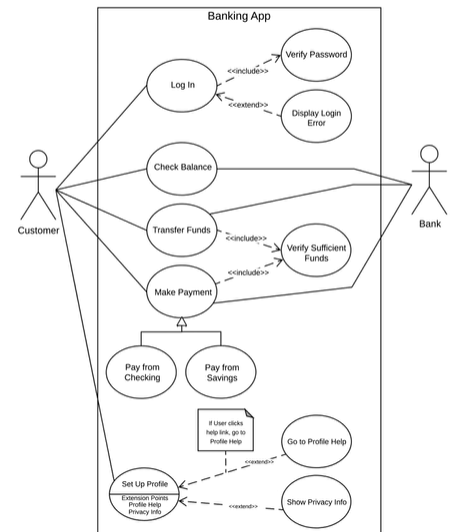
Include/Exclude/Extention point in Usecase Diagram
3- State Machine:
A UML state diagram is a type of behavioral diagram in the Unified Modeling Language (UML) that describes the dynamic behavior of a system in response to external stimuli. It shows the sequence of states that an object passes through during its lifetime in response to events. Each state is represented by a shape with the name of the state written inside it. Transitions between states are represented by arrows connected between states. The transition may have a trigger, guard conditions, and actions associated with it. UML state diagrams can be used to model the behavior of a class, a single object, or a component.
UML state diagrams are event-based. Events are represented by transitions between states and can have triggers, guard conditions, and actions associated with them.


A Nested State is a state inside other states. The Composite state is a state that has a nested state inside
Event is a signal that triggers a change in state. An event can be an external stimulus, such as a button press, or an internal stimulus, such as a time-out or a transition from one state to another. Events can also be used to trigger activities or other events.
a Guard Condition is an expression that must be evaluated to true before a transition from one state to another can occur. The guard condition is used to control the flow of the state machine and restrict transitions to certain conditions. Guard conditions are typically written in a Boolean expression or a logical expression.
A Transition is a change from one state to another. In a UML state diagram, transitions are indicated by arrows connecting two states. Transitions can be triggered by events, guard conditions, or time-outs. Transitions also have associated actions, which are performed when the transition occurs.
An Action is a task or operation that is performed when a transition occurs. Actions are written in a language such as Java or C# and can be used to update the state of the system or perform other tasks. Actions can be triggered by events, guard conditions, or time-outs.
The Initial (Final) State is the starting/ending state of a state machine. It is typically represented by an oval shape.
History state is a special type of state in a state machine that stores the previous state of the system. When the system transitions to a different state, the history state stores the previous state and can be used to restore the system to its previous state. History states are typically represented by a circle with the letter H.
3-1 Event Type
Signal Event: A signal event is an external stimulus that triggers a transition in a state machine. Signal events can be generated by the user, the system, or other external sources. Signal events are typically represented by arrows with a triangle at the end pointing towards the target state.
Call Event: A call event is an event that triggers an asynchronous call to a function or procedure. A call event can be used to call a function or procedure in response to an event, such as a button press or a timeout. Call events are typically represented by arrows with a hexagon at the end pointing toward the target state.
The main difference between a call event and a signal event is that a call event triggers an asynchronous call to a function or procedure, while a signal event triggers a transition in a state machine. Additionally, a call event is typically represented by arrows with a hexagon at the end pointing toward the target state, while a signal event is typically represented by arrows with a triangle at the end pointing toward the target state.
Time Event: Occurs after a specified time has elapsed
Change Event: Occurs whenever the specific condition is met
4- Interaction
4-1 Sequence
4-2 Communication
4-3 Interaction Overview
4-4 Timing
UML DB
The “0.. *” notation is used to denote “zero or more” (many). The following notation indicates that every object in Class A is associated with zero or more objects in Class B, and that every object in Class B is associated with exactly one object in Class A.
Cardinality: Cardinality in a database is a measure of the relationship between two tables. It describes the maximum number of associated records that exist between two tables. It is expressed as either one-to-one (1:1), one-to-many (1:M) or many-to-many (M:M).
