non-linear loads cause harmonic distortion in electrical systems. Why? Linear loads (like resistors, incandescent bulbs, and traditional motors) draw current proportional to voltage and maintain a sinusoidal wave.
Non-linear loads (like variable frequency drives, LED lights, computers, and rectifiers) draw current in pulses instead of a smooth sine wave. This distorts the current waveform, introducing harmonics (multiples of the fundamental frequency). A pure sinusoidal wave has only the fundamental frequency (e.g., 50 Hz or 60 Hz). Non-linear loads generate harmonics (multiples of the fundamental frequency: 150 Hz, 250 Hz)
Harmonic Distortion reductions
Harmonic distortion reduction minimizes unwanted harmonic components in AC power systems. Harmonic distortions are sinusoidal wave components other than the fundamental frequency. Harmonic distortions can cause overheating, equipment damage, and nuisance tripping in the power grid. Active or passive filters reduce harmonic distortions in power distribution systems. A voltage regulator, PWM controller, and other devices can also reduce harmonic distortion.
THD (Total Harmonic Distortion) is the ratio between harmonic components and the fundamental voltage or current. In addition to being expressed as a percentage, TOHD (Transient or Oscillatory Harmonic Distortion) is calculated as the ratio of transient harmonic components to fundamental voltage or current. A TEHD (Temporary or Event Harmonic Distortion) is the ratio of transient events, such as switching and lightning transients, to the fundamental voltage or current. As a percentage of the fundamental voltage, individual harmonics to 31st refer to the amplitudes of each of the 31 individual harmonics observed in the voltage or current. Unbalance is the ratio of absolute differences between positive and negative sequence voltages or currents. These parameters are used in electrical networks to observe and measure power quality.

THD should be calculated at the transformer rather than at the harmonic-generating loads
Clarify
- Total Harmonic Distortion (THD):
- THD measures how much harmonic distortion is present in the signal compared to the fundamental frequency. It’s expressed as a percentage, calculated as the ratio of the root-sum-square of all harmonic components to the root-mean-square of the fundamental component.
- Example: If a power system has a 50 Hz fundamental frequency, and the sum of all harmonics is 10% of the fundamental frequency’s amplitude, the THD is 10%. A high THD means the waveform is significantly distorted, which can cause overheating and efficiency loss in motors and transformers.
- Transient or Oscillatory Harmonic Distortion (TOHD):
- TOHD represents short-lived disturbances (transients) in the harmonic spectrum that can oscillate or “ring” at higher frequencies before damping out. These transients often arise from sudden changes in load, switching operations, or faults in the power network.
- Example: If switching on a large motor generates a 200 Hz oscillation that lasts briefly, TOHD measures the ratio of this oscillatory disturbance to the fundamental voltage. If the oscillatory component is 5% of the fundamental, TOHD would be 5%.
- Temporary or Event Harmonic Distortion (TEHD):
- TEHD captures the distortion from short-term events like switching surges, lightning strikes, or other brief, intense disruptions in the system. TEHD quantifies how these events distort the waveform relative to the main (fundamental) frequency.
- Example: A lightning strike near a power line could cause a sudden spike, temporarily pushing the waveform out of shape. If this spike is 15% of the amplitude of the fundamental voltage, TEHD would register as 15% during this event. TEHD helps utilities assess and mitigate the impact of these events on power quality.
- Individual Harmonics up to the 31st:
- Measuring individual harmonics up to the 31st harmonic helps to analyze specific harmonic contributions to overall distortion. For instance, the 3rd, 5th, and 7th harmonics are often most impactful, so monitoring their amplitudes relative to the fundamental is essential.
- Example: If a system experiences a 3rd harmonic amplitude that’s 2% of the fundamental and a 5th harmonic amplitude that’s 3%, these individual harmonics are significant enough to warrant attention. Individually measured harmonics help diagnose and locate sources of specific distortions.
- Unbalance:
- Unbalance measures the difference between the positive sequence (normal direction of current flow) and negative sequence (reverse direction) voltages or currents in a three-phase system. Unbalance often occurs when the loads across phases are not evenly distributed, causing overheating and inefficiency.
- Example: If a three-phase system has voltages of 230V, 220V, and 215V across each phase, there’s a significant unbalance. If this difference is calculated as 5% of the positive sequence component, the system has a 5% unbalance. High unbalance can damage equipment like motors, which rely on balanced currents for efficient operation.
Note that When we say there’s a 10% THD with a 220V fundamental amplitude, it doesn’t mean the peak voltage is simply increased by 22V (or 10%) to become 242V. Instead, the 22V represents the combined “distorted” components contributed by the harmonics, not a direct peak increase.
Here’s how it works:
- Fundamental Voltage: If the fundamental voltage is 220V RMS, its peak voltage is actually 220×2≈311220 \times \sqrt{2} \approx 311220×2≈311 volts (since peak voltage for a sine wave is RMS×2\text{RMS} \times \sqrt{2}RMS×2).
- Harmonic Contribution: A 10% THD means that the root-sum-square of all harmonic components equals 10% of 220V, or 22V RMS. These harmonics are additional frequencies that distort the waveform but don’t directly add to the fundamental in a straightforward way.
- Distorted Waveform Peak: The resulting waveform with all harmonics included may have peaks higher or lower than 311V, depending on the specific harmonics and their phase. However, this doesn’t simply mean a new peak of 311V + 22V = 333V. The actual peak will vary based on how these harmonics combine with the fundamental.
In summary, a 10% THD introduces a distortion with an equivalent RMS value of 22V, but it does not linearly add to the fundamental’s peak. Instead, it reshapes the waveform, potentially increasing or decreasing its peaks.
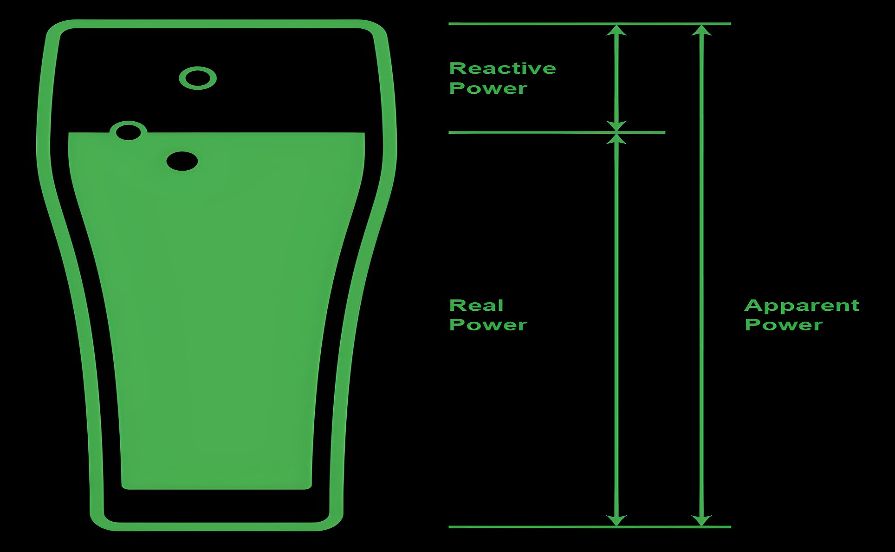
Power Factor Correction
The power factor is the ratio of active power to total power consumed by a load. When the power factor is low, reactive power is used to supply the load, while when it is high, the load is closer to a reactive-free load. Power factor correction is used to correct low power factors to improve efficiency. Capacitive loads are typically added to electrical systems to achieve this. A power factor correction reduces system losses and increases efficiency, allowing electricity to be used more efficiently.
An active power factor correction approach entails using a full power converter stage between the diode bridge and the isolated DC/DC converter. While this approach is more complex, an active PFC offers superior power factor performance with little degradation over a wide operating range.
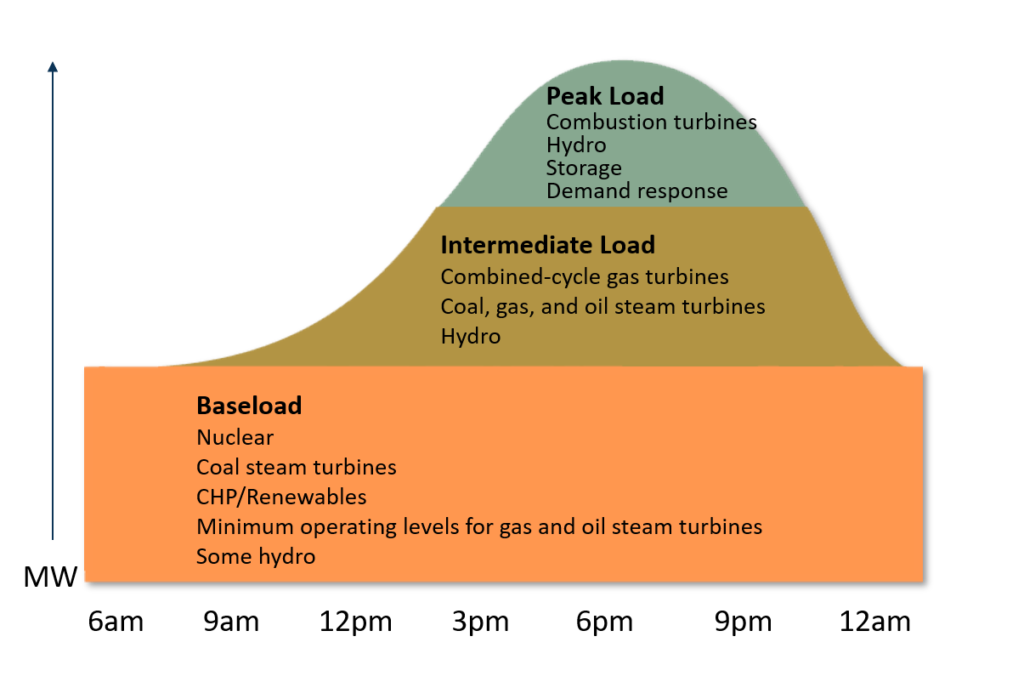
Load Management
Load management plays a crucial role in power quality by controlling and optimizing how and when electrical loads draw power from the grid. This relationship between load management and power quality is important because unmanaged or poorly managed loads can lead to several power quality issues,
PLCs (Peak Load Contributions) and ICAP (Installed Capacity) are primarily associated with the production and transmission aspects of the power system, rather than directly with end-user equipment like power factor correction switchboards or capacitor banks.
PLCs (Peak Load Contributions) represent customers’ contribution to peak grid demand during specified periods.
ICAP (Installed Capacity), also known as the Rated Nominal Capacity, Nameplate Capacity, Or Maximum Effect, is the intended full-load sustained output of a facility such as a Power Station, Electric Generator, Chemical Plant, fuel plant, mine, metal refinery, and many others.

Power Clients Power Quality
End users’ responsibilities for maintaining power quality directly impact their bills in several ways:
- Power Factor: Low power factor results in penalties; maintaining a high power factor avoids these charges.
- Peak Demand (PLC): High peak demand results in demand charges; managing peak loads can lower these costs.
- Harmonic Distortion: Excessive harmonics can lead to penalties; using filters helps avoid additional charges.
- Equipment Protection: Failing to manage voltage transients and surges can increase repair and maintenance costs, indirectly affecting operational expenses.
- Load Balancing: Unbalanced loads can cause equipment inefficiency, leading to higher energy and maintenance costs.
1. Responsibility for Power Factor
- What End Users Are Responsible For: End users, especially industrial and commercial clients, are responsible for managing their power factor. Poor power factor (low power factor) means inefficient use of electrical power, where more current is drawn for the same amount of real power.
- Billing Impact: Many utilities impose additional charges for low power factor, as it leads to greater strain on the grid. To avoid these charges, end users often install power factor correction equipment, like capacitor banks, to improve their power factor and reduce reactive power.
- Example: A factory with a low power factor might see extra charges on its electricity bill labeled as “power factor penalties.” By installing power factor correction, the factory can avoid these penalties, leading to lower bills.
2. Responsibility for Peak Load Contributions (PLCs)
- What End Users Are Responsible For: End users are responsible for managing their peak demand or peak load contributions, which refers to the maximum amount of power they draw from the grid during peak hours.
- Billing Impact: Utilities often have demand charges based on the highest level of demand a user has in a billing period. If a user’s peak demand is high, their bill will reflect these higher costs, as demand charges aim to offset the strain placed on the grid during peak periods. Some utilities offer incentives for reducing demand during peak hours.
- Example: A commercial building that runs all HVAC and lighting systems simultaneously during peak hours will have a high PLC. This results in higher demand charges, which can be reduced by managing load, like staggering HVAC startup times.
3. Responsibility for Harmonic Distortion
- What End Users Are Responsible For: End users, especially those with equipment that generates harmonic distortion (e.g., variable frequency drives, computers, or non-linear loads), are responsible for managing these harmonics to avoid affecting both their own equipment and the utility grid.
- Billing Impact: In some cases, utilities impose charges or penalties for excessive harmonic distortion, as it can lead to equipment failures and inefficiencies across the grid. End users often install harmonic filters to limit distortion levels and avoid potential penalties. Note that retailers may charge large users based on their Total Harmonic Distortion (THD) levels.
- Example: An industrial site with high harmonic distortion may face additional charges from the utility if it exceeds a certain threshold. By using filters, the site can stay within acceptable levels and avoid such charges.
4. Responsibility for Voltage Transients and Surge Protection
- What End Users Are Responsible For: End users are responsible for protecting their own equipment from voltage transients and surges, which can originate internally or from external sources like the utility grid.
- Billing Impact: While there isn’t typically a direct surcharge for transients, the costs of not managing them can indirectly impact the end user. For example, equipment damage and unplanned downtime lead to higher operational costs and maintenance expenses, which can be considered part of the “cost of poor power quality.”
- Example: A commercial business that fails to protect its computers from voltage transients may experience frequent failures and higher maintenance costs, indirectly raising its overall operational expenses.
5. Responsibility for Load Balancing
- What End Users Are Responsible For: In three-phase systems, end users are responsible for balancing loads across phases. Unbalanced loads can lead to issues like voltage sags and heating in transformers and motors, potentially affecting power quality and equipment performance.
- Billing Impact: While utilities may not directly charge for load imbalances, an imbalanced load can increase wear on equipment and lead to inefficiencies, increasing maintenance costs. Additionally, some utilities might impose penalties if severe imbalance issues impact grid stability.
- Example: A manufacturing plant that fails to balance its load across phases might experience frequent motor repairs, raising operating costs over time.
IEC 61000-40 30
The IEC 61000-4-30 standard defines methods for measuring and interpreting power quality parameters in AC power supply systems (50/60 Hz). Here’s a concise breakdown of its key aspects:
- Scope & Purpose: Applies to in-situ measurements of conducted phenomena in low-voltage commercial and residential environments. Ensures repeatable and comparable results across devices by standardizing measurement methods, accuracy, and time aggregation.
- Key Parameters Measured: The standard covers:
- Power frequency (42.5–57.5 Hz / 51–69 Hz) with 10 mHz uncertainty.
- Voltage magnitude, dips/swells, interruptions, and transients.
- Harmonics/interharmonics (using IEC 61000-4-7’s 10/12-cycle FFT subgroup method).
- Flicker (per IEC 61000-4-15), voltage unbalance, and rapid voltage changes (RVC).
- Current measurements (added in the 3rd edition).
- Performance Classes:
- Class A: Highest accuracy for contractual/compliance use (e.g., regulatory audits).
- Class S: Lower accuracy for statistical surveys.
- Class B: Obsolete (removed in the 3rd edition).
- Performance Classes
- AS/NZS IEC 61000.4.30:2023 adopts the IEC standard locally.
- For regulatory compliance, Class A instruments are recommended for enforceable measurements
